Коммутаторы NETGEAR S3300-28X (GS728TX) 24x1GE - инструкция пользователя по применению, эксплуатации и установке на русском языке. Мы надеемся, она поможет вам решить возникшие у вас вопросы при эксплуатации техники.
Если остались вопросы, задайте их в комментариях после инструкции.
"Загружаем инструкцию", означает, что нужно подождать пока файл загрузится и можно будет его читать онлайн. Некоторые инструкции очень большие и время их появления зависит от вашей скорости интернета.

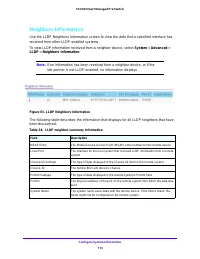
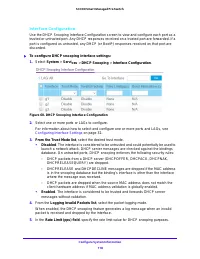
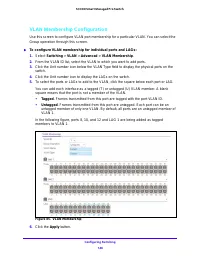
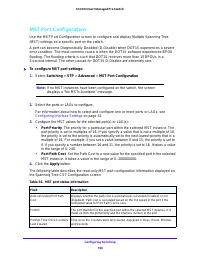
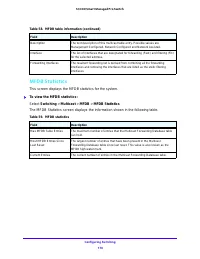
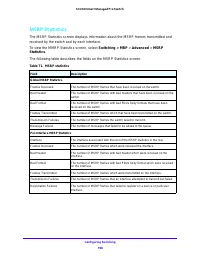
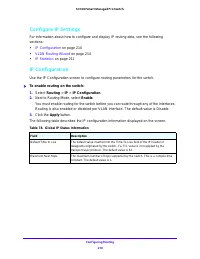

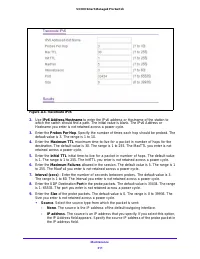
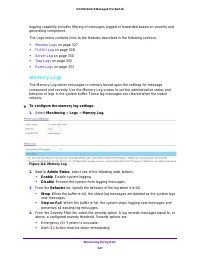

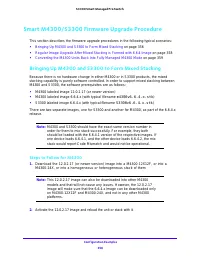
Monitoring the System
318
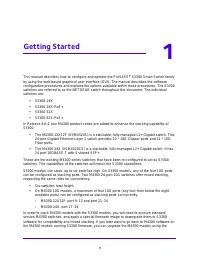
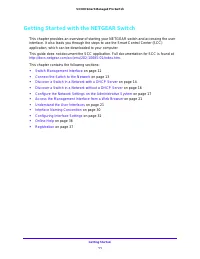
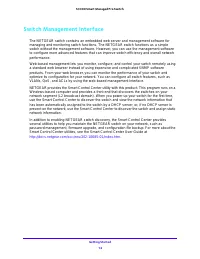
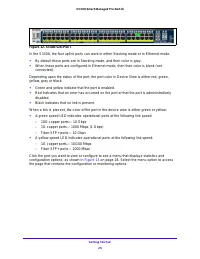
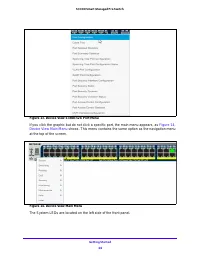
S3300 Smart Managed Pro Switch
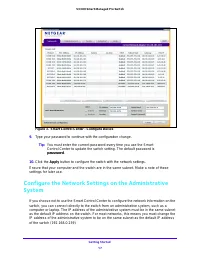
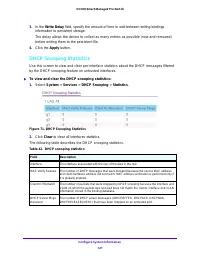
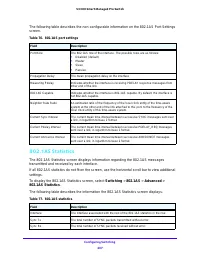
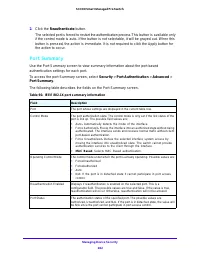
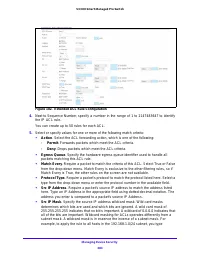
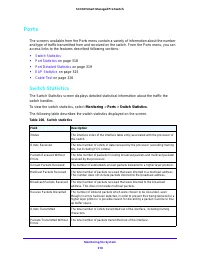
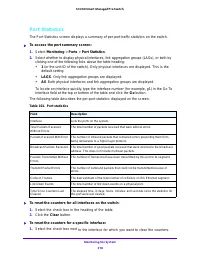
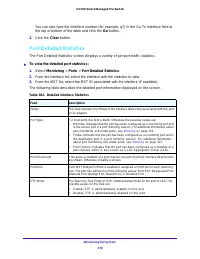
Port Statistics
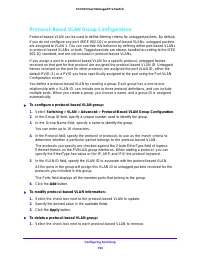
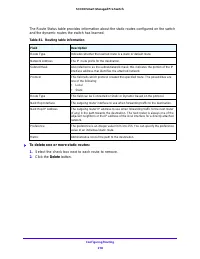
The Port Statistics screen displays a summary of per-port traffic statistics on the switch.
To access the port summary screen:
1.
Select
Monitoring
>
Ports
>
Port Statistics
.
2.
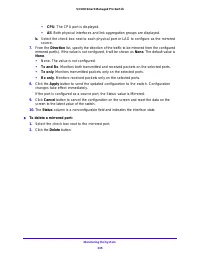
Select whether to display physical interfaces, link aggregation groups (LAGs), or both by
clicking one of the following links above the table heading:
•
1
(or the unit ID of the switch). Only physical interfaces are displayed. This is the
default setting.
•
LAGS
. Only link aggregation groups are displayed.
•
All
. Both physical interfaces and link aggregation groups are displayed.
To locate an interface quickly, type the interface number (for example, g1) in the Go To
Interface field at the top or bottom of the table and click the
Go
button.
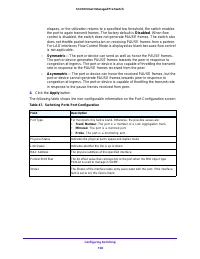
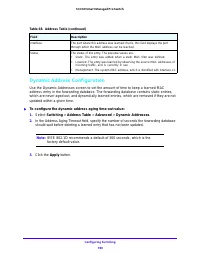
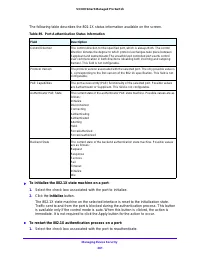
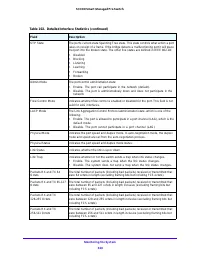
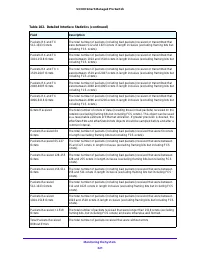
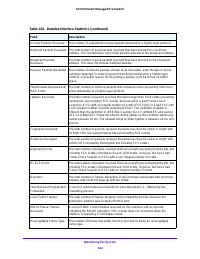
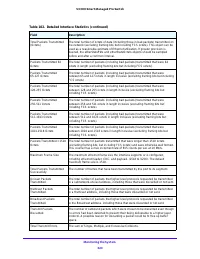
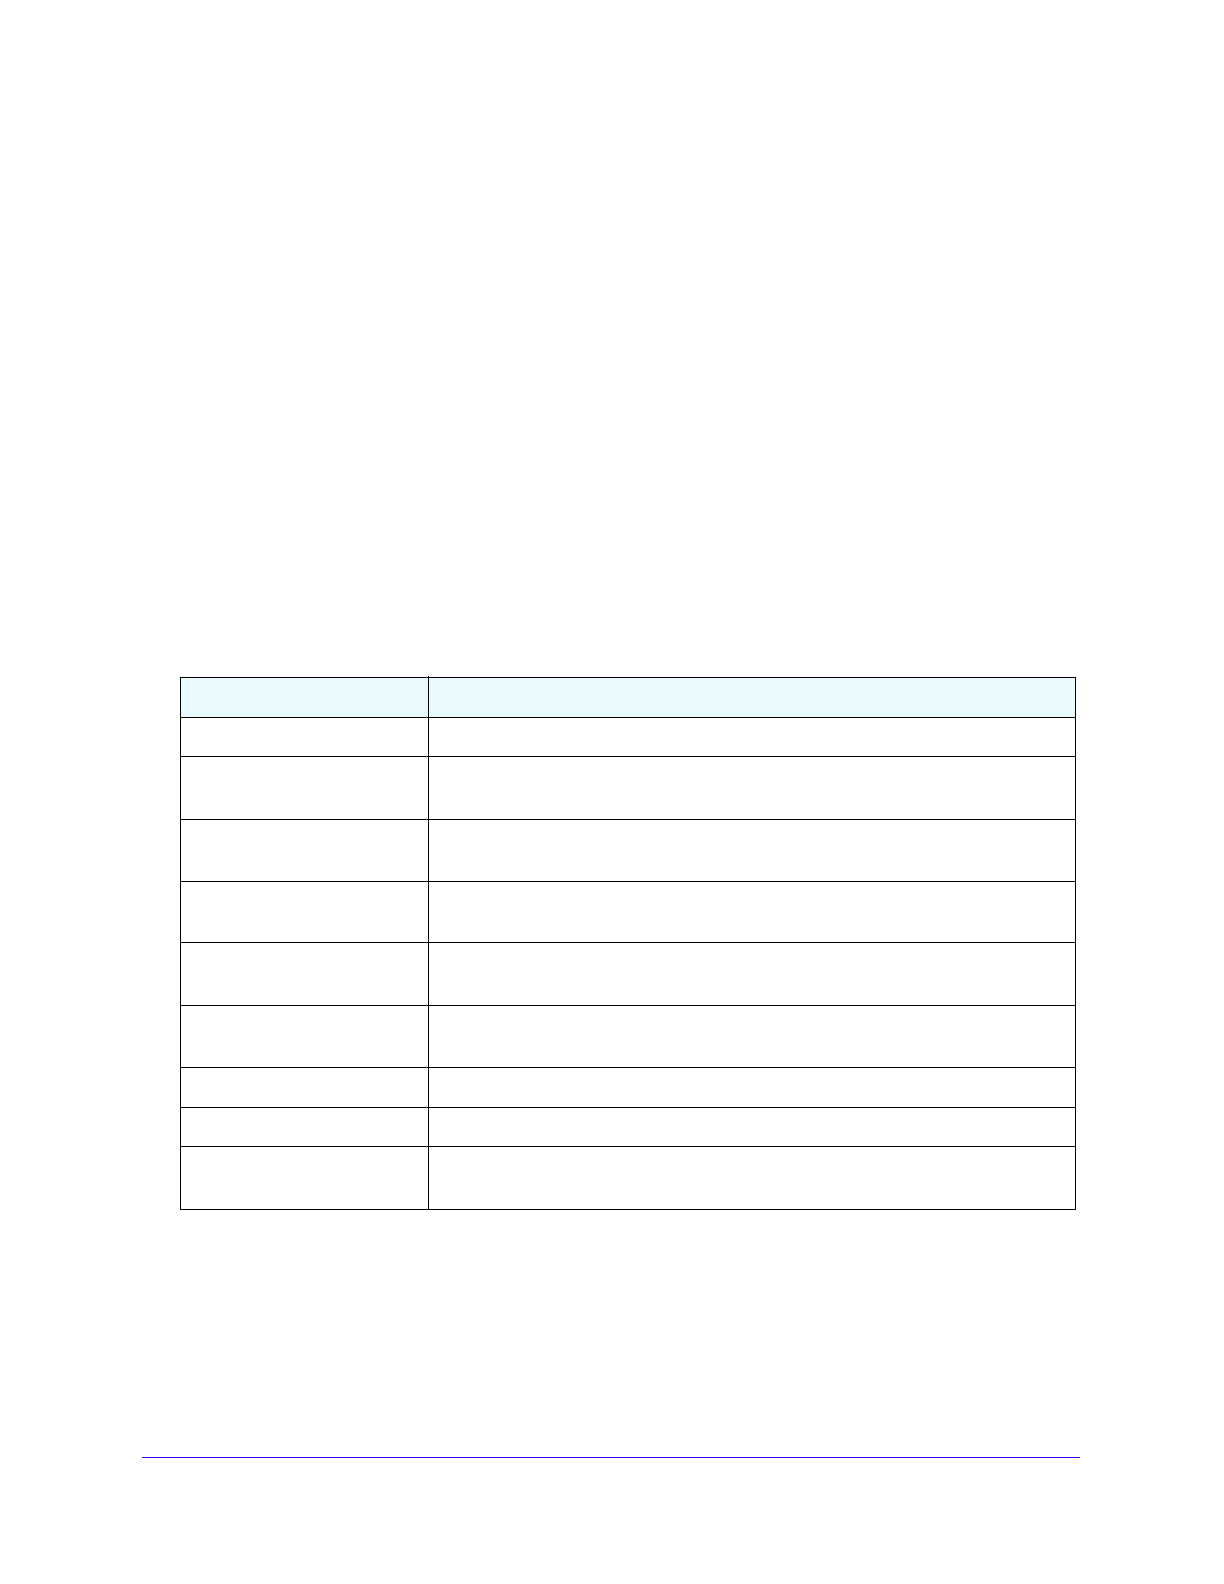
The following table describes the per-port statistics displayed on the screen.
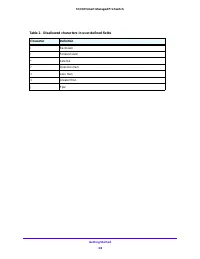
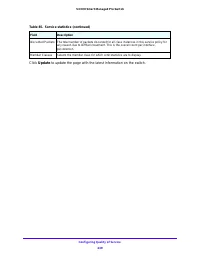
Table 101. Port statistics
Field
Description
Interface
Lists the ports on the system.
Total Packets Received
Without Errors
The total number of packets received that were without errors.
Packets Received With Error
The number of inbound packets that contained errors preventing them from
being deliverable to a higher layer protocol.
Broadcast Packets Received
The total number of good packets received that were directed to the broadcast
address. This does not include multicast packets.
Packets Transmitted Without
Errors
The number of frames that have been transmitted by this port to its segment.
Transmit Packet Errors
The number of outbound packets that could not be transmitted because of
errors.
Collision Frames
The best estimate of the total number of collisions on this Ethernet segment.
Link Down Events
The total number of link down events on a physical port.
Time Since Counters Last
Cleared
The elapsed time, in days, hours, minutes, and seconds since the statistics for
this port were last cleared.
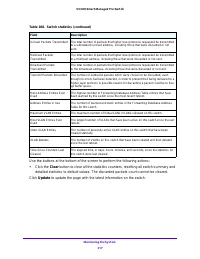
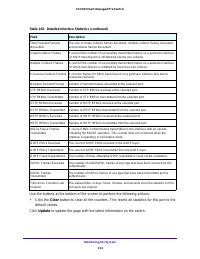
To reset the counters for all interfaces on the switch:
1.
Select the check box in the heading of the table.
2.
Click the
Clear
button.
To reset the counters for a specific interface:
1.
Select the check box next to the interface for which you want to clear the counters.
Характеристики

Остались вопросы?Не нашли свой ответ в руководстве или возникли другие проблемы? Задайте свой вопрос в форме ниже с подробным описанием вашей ситуации, чтобы другие люди и специалисты смогли дать на него ответ. Если вы знаете как решить проблему другого человека, пожалуйста, подскажите ему :)
